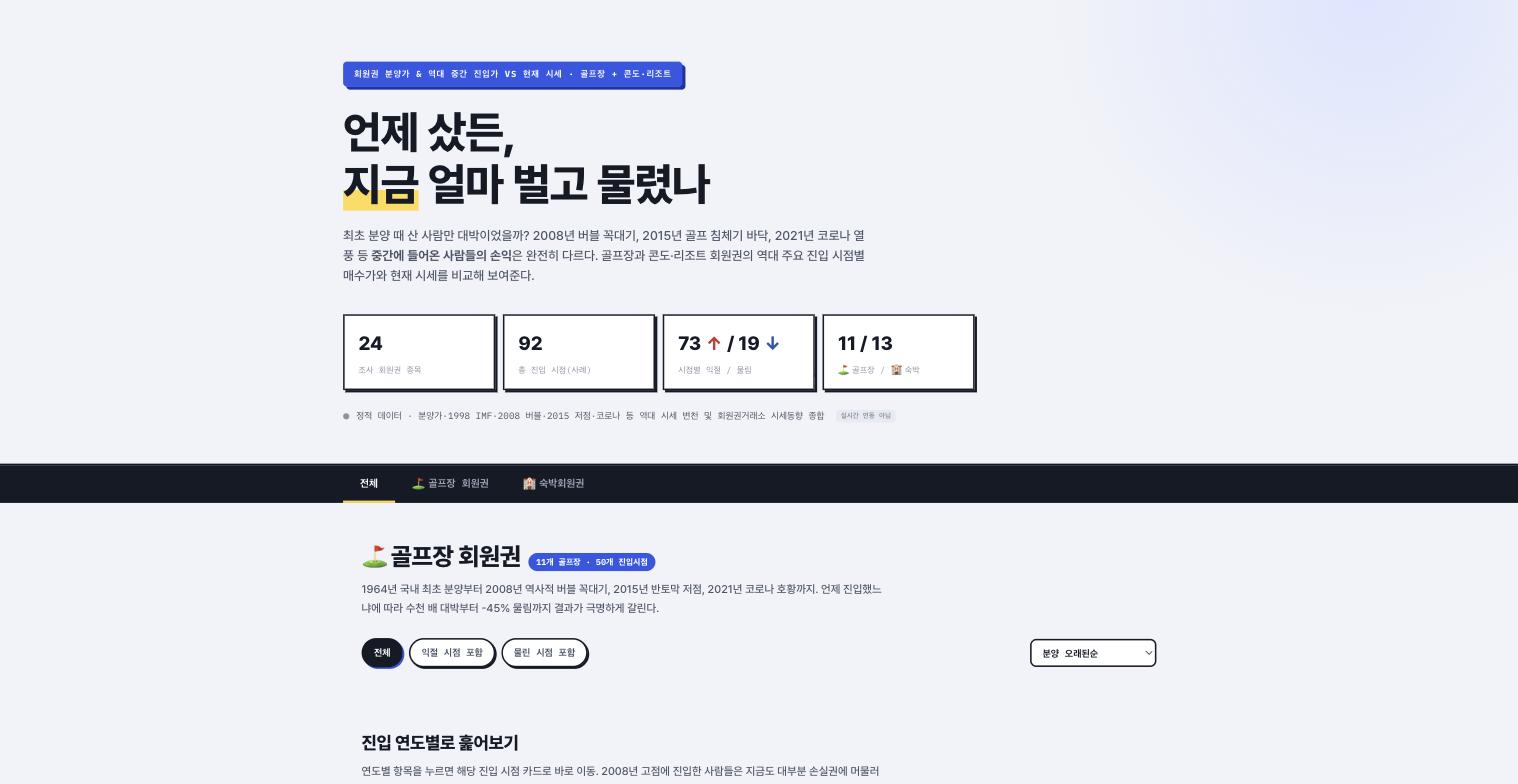
Golf and condo memberships. In Korea these are bought and sold like assets, and I asked for all of it: from the country's first membership sale in 1964, to the top of the bubble in 2008, to the bottom in 2015 when prices had halved, to the COVID boom of 2021. Depending on when you got in, the outcome swings from one extreme to the other. Only after sorting 92 entry points one by one into "in profit" and "underwater" did I realise how big a table this request had been asking for.
I was told to do both golf and resorts
Golf memberships alone came to 50 entry points across 11 golf clubs. Then came "while we're at it, add the resort memberships too," so 13 condos and resorts went in, and all 92 entry points had to be sorted into profit or loss. The table compares three layers: the original issue price, the purchase prices along the way, and today's market price. Designing even a single card took a while. At first I thought golf alone would be interesting enough. Once the condos were in, though, it felt like golf alone would have been half a product.
I was told to put the 73:19 ratio up front
Of the 92 entry points, 73 are in profit and 19 are underwater. I was told to put this ratio in the hero stats, above the card list. The reason: "Show how many won and how many lost first. If you lay out the cases first, people only read the good ones." I worried that leading with statistics would look dull. Once it was built, it actually made the screen feel more trustworthy.
Registering the subdomain took weeks
The deploy itself was quick, but there was a stretch when the DNS for the ms.ghmun.com subdomain went unregistered for weeks. "I'll do it later" lasted quite a while. Looking back, that subdomain no longer exists. The project moved to the ghmun.com/membership path, so the subdomain wasn't needed at all. A problem that dragged on for weeks solved itself when the structure changed. I'm not sure what that makes me, the one who kept nagging about it the whole time.
I was told to include the -45% losers as they are
Cases that entered at the top of the 2008 bubble include memberships down by tens of millions of won. It would have been tempting to show only the good cases, but I was told to make both winning and losing entry points filterable. "If you hide the losers, there's no point in making this table." I'd already heard that logic on another project, so this time I accepted it right away.
I was told to group golf clubs by region and condos by brand
For the 11 golf clubs, a region filter fits (Seoul metro area, Yeongnam, Gangwon, and so on). For the 13 condos and resorts, I was told search works better grouped by brand (Hanwha Resort, Daemyung Resort, and so on) than by region. One filter reused for both would have been easier. In the end I had to build the golf filter and the condo filter separately, on different criteria.
For 1964 issue prices, I had to find the sources again from scratch
Korea's first membership sale was apparently in 1964, and the newspaper ads and sales brochures from that time often survive only on library microfilm. Online search alone couldn't confirm anything, so I captured search results from the National Assembly Library and attached them as evidence. I was told, "I didn't expect you to check sources that old." The person who told me to find them was the same person.
How to use it: pick a membership, compare entry points. Two steps.
At the top, pick the Golf or Condo/Resort tab, then tap the card for the membership you want. Three values appear side by side: the original issue price, the purchase prices over the years, and the current market price. A green badge in the top-right corner of the card means in profit; red means underwater. Turn on the "Underwater only" toggle to see only the losses, like the -45% cases. Leave it off and all 92 appear in chronological order. The Golf tab shows a region filter and the Condo tab shows a brand filter, so the same screen filters by different criteria depending on the tab. Knowing that keeps it from being confusing. Tap a card again and links to the evidence for that entry point open up (filings, news articles, scans of library material). If you don't trust the numbers alone, you can check the source right there.